
Financial Information
The graph and table describes the highlights of the consolidated financial statement of OTSUKA CORPORATION.(Years ended December 31. Based on the Annual Securities Report filed on March 27, 2024)
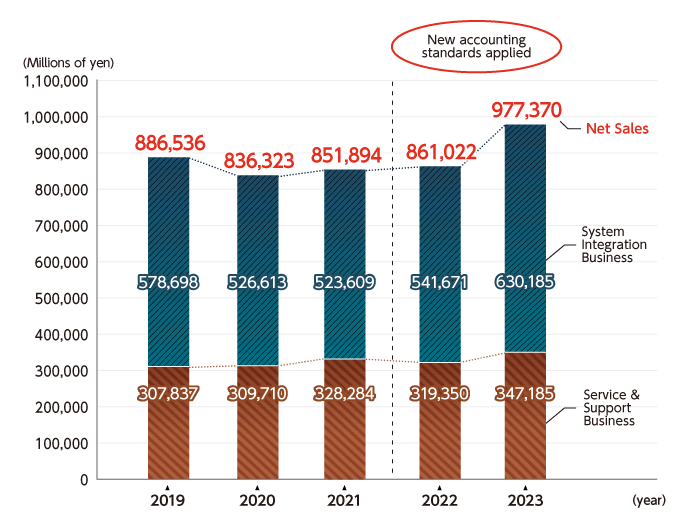
Net Sales 2019-2023
Net Sales (by business)
| 2019 | 2020 | 2021 | 2022 | 2023 | |
|---|---|---|---|---|---|
| Net Sales | 886,536 | 836,323 | 851,894 | 861,022 | 977,370 |
| System Integration Business | 578,698 | 526,613 | 523,609 | 541,671 | 630,185 |
| Service and Support Business | 307,837 | 309,710 | 328,284 | 319,350 | 347,185 |
OTSUKA CORPORATION applies “Accounting Standard for Revenue Recognition” (ASBJ Statement No. 29) from the beginning of the 2022 consolidated accounting period.
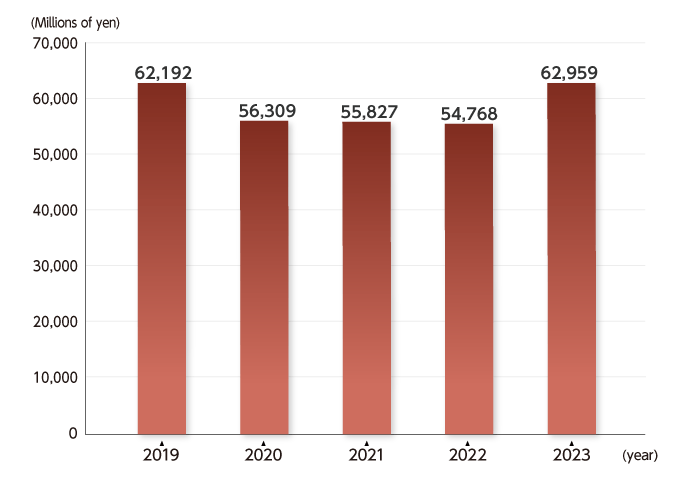
Operating profit / Ordinary profit / Profit attributable to owners of parent 2019-2023
Operating profit
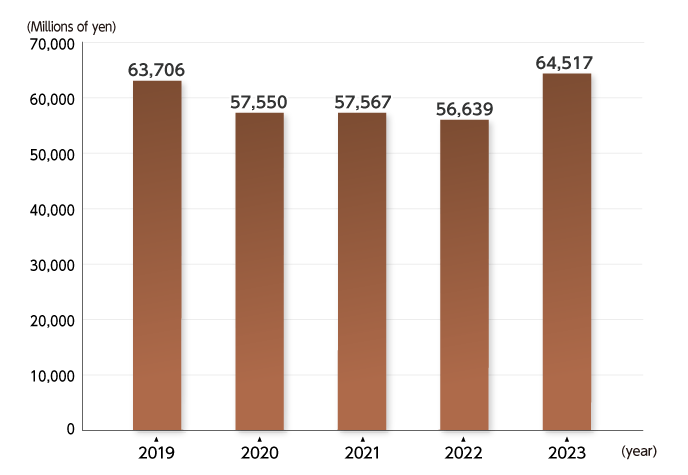
Ordinary profit
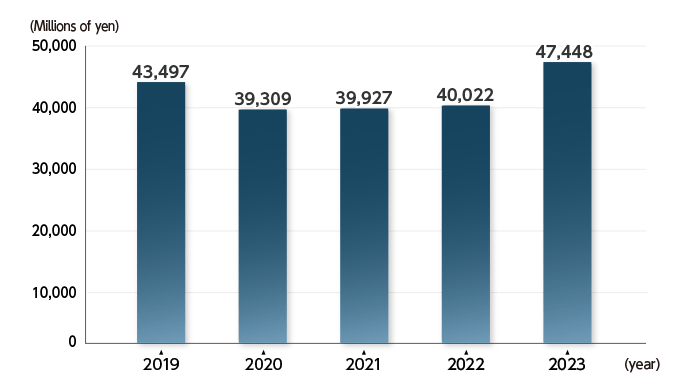
Profit attributable to owners of parent
| 2019 | 2020 | 2021 | 2022 | 2023 | |
|---|---|---|---|---|---|
| Operating profit | 62,192 | 56,309 | 55,827 | 54,768 | 62,959 |
| Ordinary profit | 63,706 | 57,550 | 57,567 | 56,639 | 64,517 |
| Profit attributable to owners of parent | 43,497 | 39,309 | 39,927 | 40,022 | 47,448 |
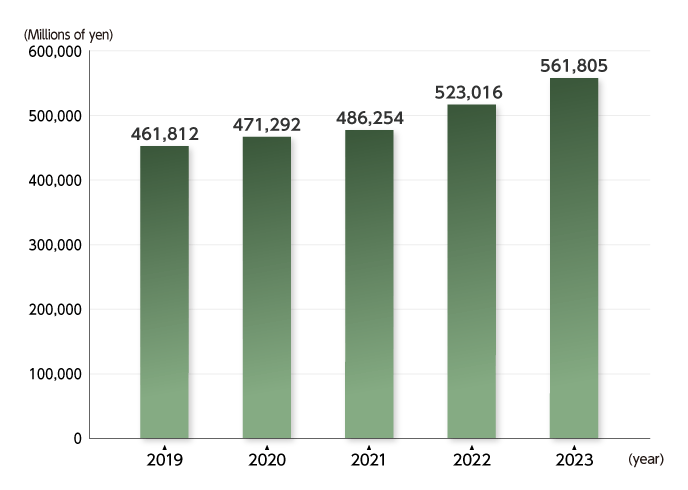
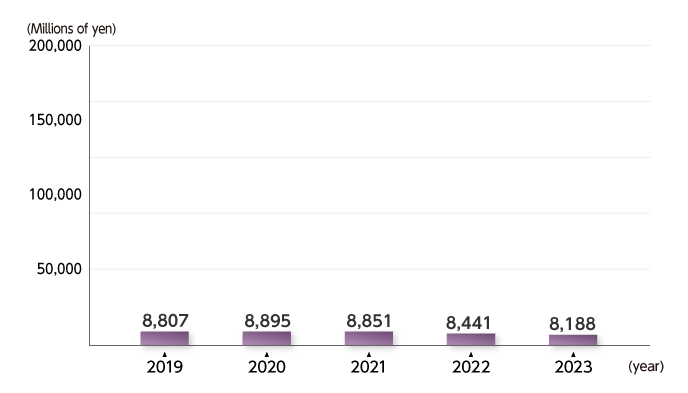
Total Assets / Interest-Bearing Debt 2019-2023
Total Assets
Interest-Bearing Debt
| 2019 | 2020 | 2021 | 2022 | 2023 | |
|---|---|---|---|---|---|
| Total Assets | 461,812 | 471,292 | 486,254 | 523,016 | 561,805 |
| Interest-Bearing Debt | 8,807 | 8,895 | 8,851 | 8,441 | 8,188 |
Figures are in millions of yen.
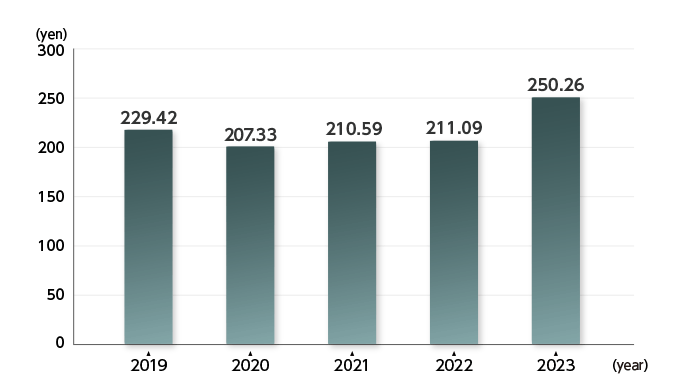
Earnings Per Share (EPS) 2019-2023
Earnings Per Share (EPS)
| 2019 | 2020 | 2021 | 2022 | 2023 | |
|---|---|---|---|---|---|
| Earnings Per Share | 229.42 | 207.33 | 210.59 | 211.09 | 250.26 |
EPS is in yen.
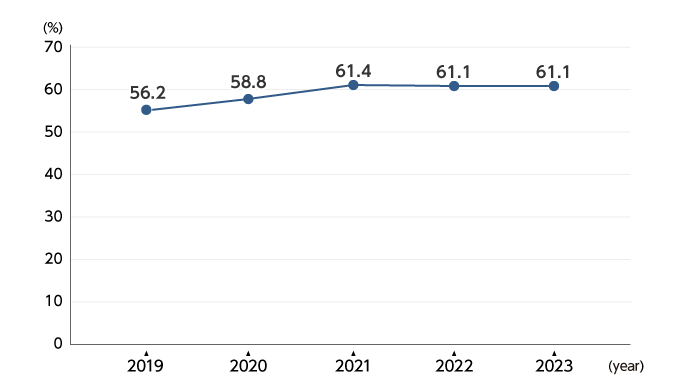
Equity Ratio 2019-2023
Equity Ratio
| 2019 | 2020 | 2021 | 2022 | 2023 | |
|---|---|---|---|---|---|
| Equity Ratio (%) | 56.2 | 58.8 | 61.4 | 61.1 | 61.1 |
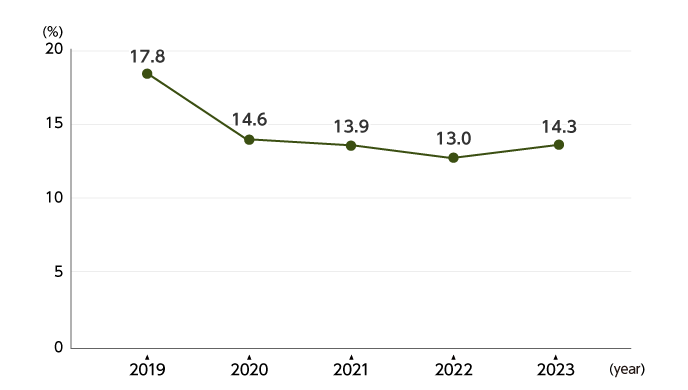
Return on Equity (ROE) 2019-2023
Return on Equity (ROE)
| 2019 | 2020 | 2021 | 2022 | 2023 | |
|---|---|---|---|---|---|
| Return on Equity (%) | 17.8 | 14.6 | 13.9 | 13.0 | 14.3 |
Equity = Total net assets - Share subscription rights - Non-controlling interests
- Note:The amounts shown in this page have been rounded down to the nearest whole number.
Navigation Menu