
Sales and Number of Employees
Sales growth and number of employees since its establishment until 2025.
Sales and Number of Employees
This is a non-consolidated sales graph since its establishment in 1961 until 2025. The results were 869.5 billion yen in 2023, 985.1 billion yen in 2024, 1.1631 trillion yen in 2025.
* The sales and number of employees until 2000 are presented for reference.
Sales (non-consolidated)and Number of Employees
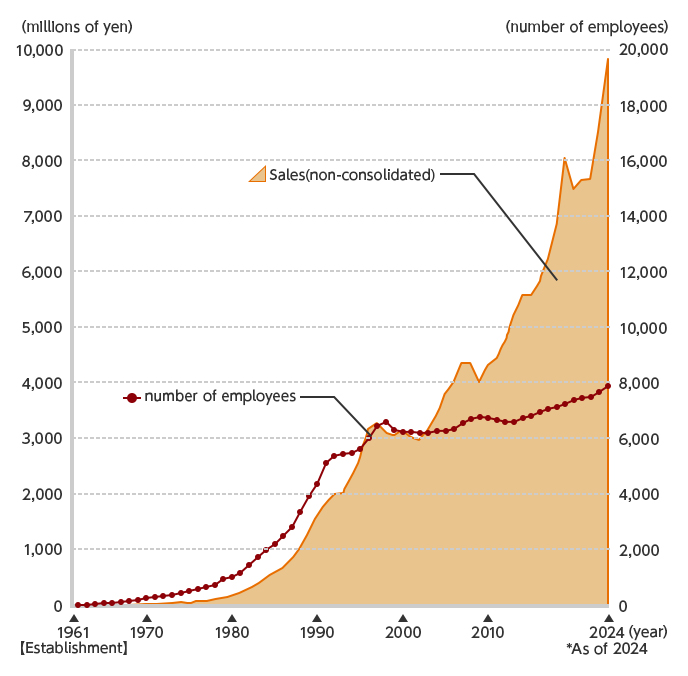
(millions of yen)
| Year | Sales (non-consolidated) | Number of Employees |
|---|---|---|
| 1962 | 64 | 16 |
| 1963 | 117 | 28 |
| 1964 | 187 | 56 |
| 1965 | 299 | 68 |
| 1966 | 444 | 97 |
| 1967 | 618 | 114 |
| 1968 | 861 | 155 |
| 1969 | 1,506 | 201 |
| 1970 | 2,300 | 261 |
| 1971 | 2,867 | 306 |
| 1972 | 3,341 | 347 |
| 1973 | 4,204 | 386 |
| 1974 | 5,078 | 450 |
| 1975 | 3,491 | 530 |
| 1976 | 7,674 | 590 |
| 1977 | 8,681 | 640 |
| 1978 | 10,465 | 750 |
| 1979 | 13,607 | 940 |
| 1980 | 17,719 | 1,030 |
| 1981 | 21,789 | 1,180 |
| 1982 | 28,877 | 1,450 |
| 1983 | 38,584 | 1,750 |
| 1984 | 49,277 | 2,000 |
| 1985 | 57,864 | 2,200 |
| 1986 | 67,946 | 2,511 |
| 1987 | 82,634 | 2,843 |
| 1988 | 102,712 | 3,361 |
| 1989 | 131,120 | 3,936 |
| 1990 | 161,299 | 4,373 |
| 1991 | 184,075 | 5,139 |
| 1992 | 200,292 | 5,380 |
| 1993 | 202,487 | 5,451 |
| Year | Sales (non-consolidated) | Number of Employees |
|---|---|---|
| 1994 | 230,507 | 5,492 |
| 1995 | 263,510 | 5,660 |
| 1996 | 319,100 | 6,056 |
| 1997 | 330,028 | 6,489 |
| 1998 | 311,724 | 6,621 |
| 1999 | 307,119 | 6,316 |
| 2000 | 314,246 | 6,272 |
| 2001 | 303,657 | 6,251 |
| 2002 | 298,198 | 6,236 |
| 2003 | 316,578 | 6,222 |
| 2004 | 342,537 | 6,294 |
| 2005 | 380,277 | 6,297 |
| 2006 | 402,886 | 6,379 |
| 2007 | 437,616 | 6,585 |
| 2008 | 437,103 | 6,736 |
| 2009 | 401,937 | 6,778 |
| 2010 | 432,919 | 6,760 |
| 2011 | 444,625 | 6,684 |
| 2012 | 474,259 | 6,638 |
| 2013 | 521,623 | 6,634 |
| 2014 | 558,450 | 6,758 |
| 2015 | 559,576 | 6,837 |
| 2016 | 584,138 | 6,985 |
| 2017 | 624,694 | 7,080 |
| 2018 | 684,912 | 7,145 |
| 2019 | 802,200 | 7,272 |
| 2020 | 750,492 | 7,429 |
| 2021 | 766,724 | 7,480 |
| 2022 | 767,649 | 7,524 |
| 2023 | 869,573 | 7,713 |
| 2024 | 985,134 | 7,949 |
| 2025 | 1,163,138 | 8,287 |
Navigation Menu