
Financial Information
The graph and table describes the highlights of the consolidated financial statement of OTSUKA CORPORATION. (Years ended December 31. Based on the Annual Securities Report filed on March 26, 2026)
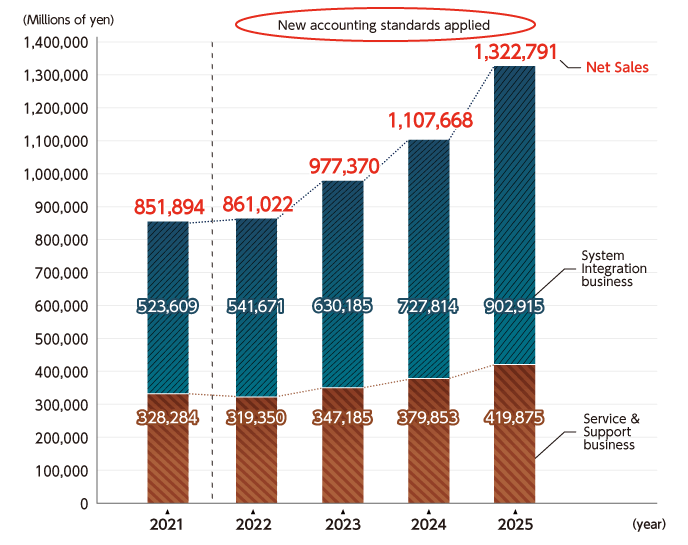
Net Sales 2021-2025
Net Sales (by business)
| 2021 | 2022 | 2023 | 2024 | 2025 | |
|---|---|---|---|---|---|
| Net Sales | 851,894 | 861,022 | 977,370 | 1,107,668 | 1,322,791 |
| System Integration Business | 523,609 | 541,671 | 630,185 | 727,814 | 902,915 |
| Service and Support Business | 328,284 | 319,350 | 347,185 | 379,853 | 419,875 |
OTSUKA CORPORATION applies “Accounting Standard for Revenue Recognition” (ASBJ Statement No. 29) from the beginning of the 2022 consolidated accounting period.
From the FY2025, we have revised some of the business results management classifications for consolidated subsidiaries and changed the classification method for business segments. Amount for the FY2024 have been calculated retroactively to reflect these changes (the impact is minor).
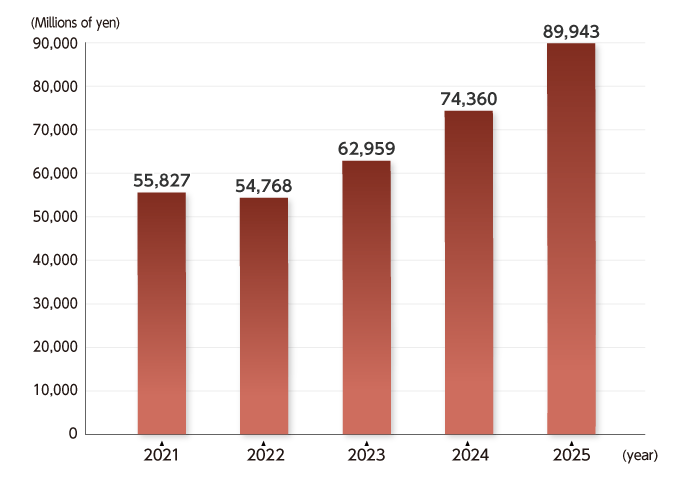
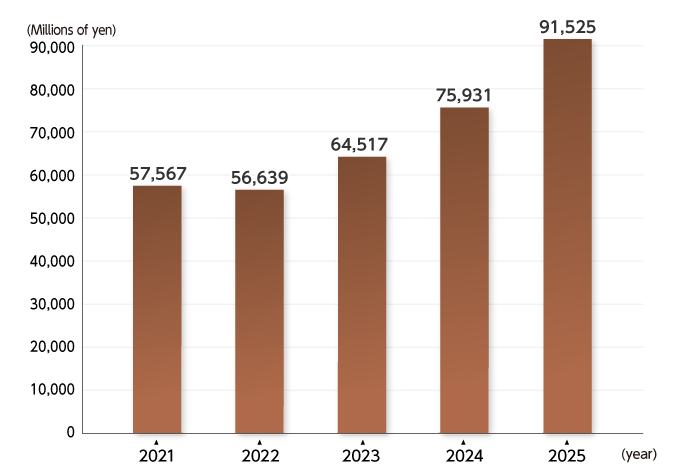
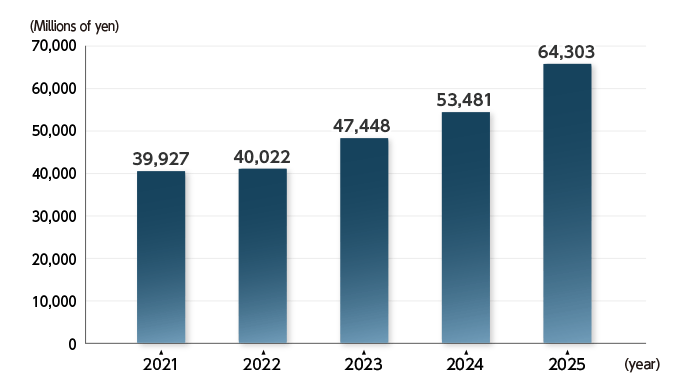
Operating profit / Ordinary profit / Profit attributable to owners of parent 2021-2025
Operating profit
Ordinary profit
Profit attributable to owners of parent
| 2021 | 2022 | 2023 | 2024 | 2025 | |
|---|---|---|---|---|---|
| Operating profit | 55,827 | 54,768 | 62,959 | 74,360 | 89,943 |
| Ordinary profit | 57,567 | 56,639 | 64,517 | 75,931 | 91,525 |
| Profit attributable to owners of parent | 39,927 | 40,022 | 47,448 | 53,481 | 64,303 |
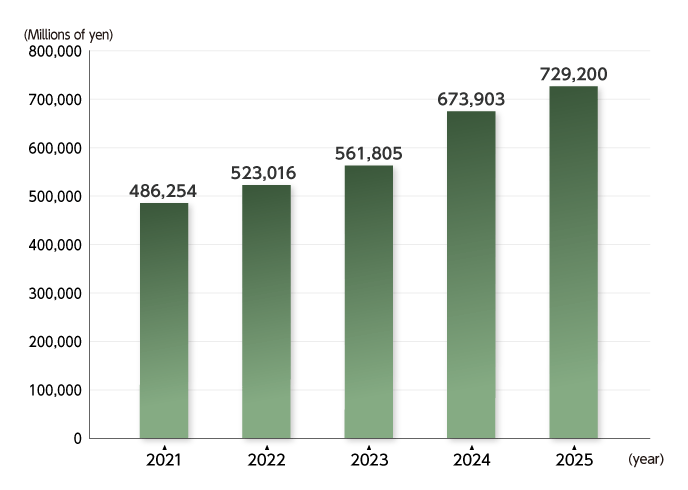
Total Assets / Interest-Bearing Debt 2021-2025
Total Assets
Interest-Bearing Debt
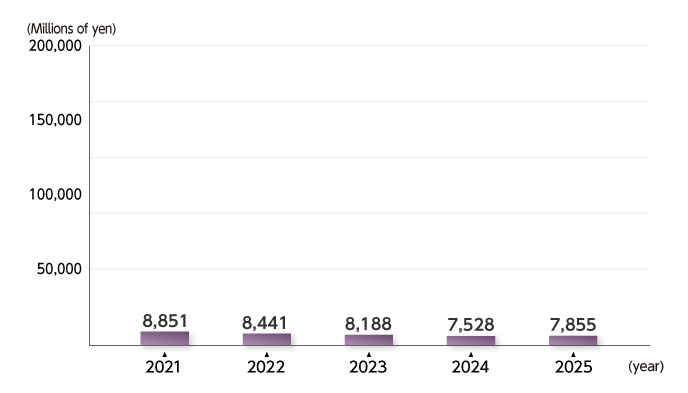
| 2021 | 2022 | 2023 | 2024 | 2025 | |
|---|---|---|---|---|---|
| Total Assets | 486,254 | 523,016 | 561,805 | 673,903 | 729,200 |
| Interest-Bearing Debt | 8,851 | 8,441 | 8,188 | 7,528 | 7,855 |
Figures are in millions of yen.
Earnings Per Share (EPS) 2021-2025
Earnings Per Share (EPS)
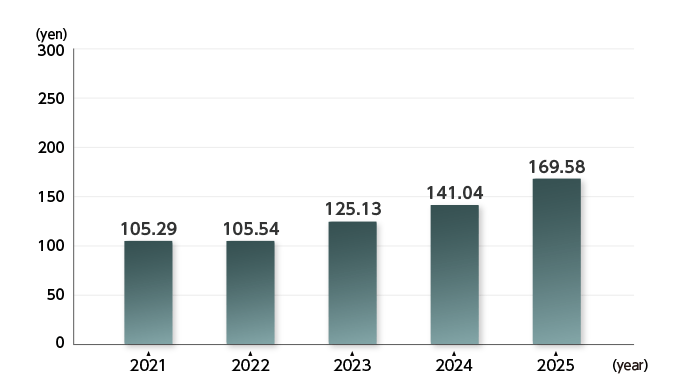
| 2021 | 2022 | 2023 | 2024 | 2025 | |
|---|---|---|---|---|---|
| Earnings Per Share | 105.29 | 105.54 | 125.13 | 141.04 | 169.58 |
EPS is in yen.
The Company conducted a 2-for-1 stock split for shares of common stock of the Company with April 1, 2024 as the effective date. Accordingly, the amount of Earnings per Share is calculated based on the assumption that the share split was conducted at the beginning of the fiscal year 2021.
Equity Ratio 2021-2025
Equity Ratio
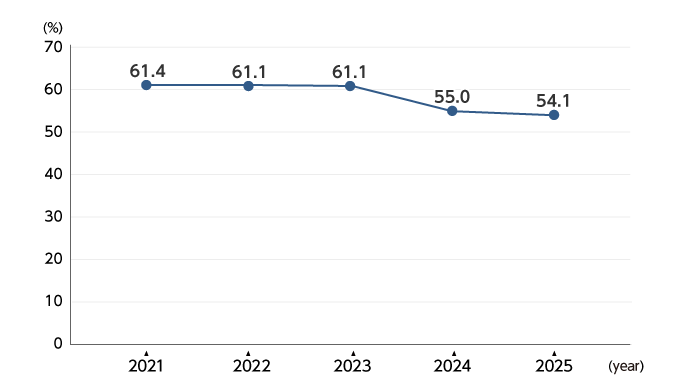
| 2021 | 2022 | 2023 | 2024 | 2025 | |
|---|---|---|---|---|---|
| Equity Ratio (%) | 61.4 | 61.1 | 61.1 | 55.0 | 54.1 |
Return on Equity (ROE) 2021-2025
Return on Equity (ROE)
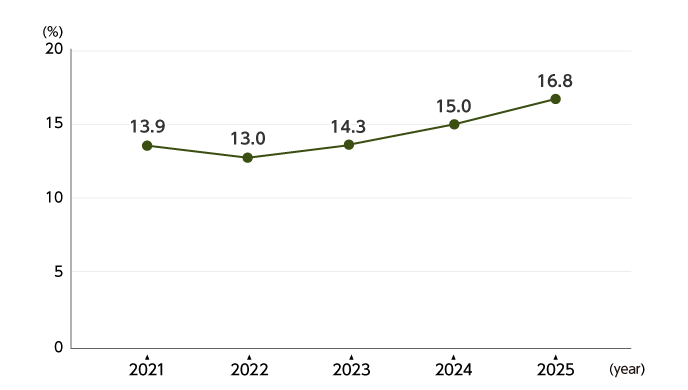
| 2021 | 2022 | 2023 | 2024 | 2025 | |
|---|---|---|---|---|---|
| Return on Equity (%) | 13.9 | 13.0 | 14.3 | 15.0 | 16.8 |
Equity = Total net assets - Share subscription rights - Non-controlling interests
- Note:The amounts shown in this page have been rounded down to the nearest whole number.
Navigation Menu